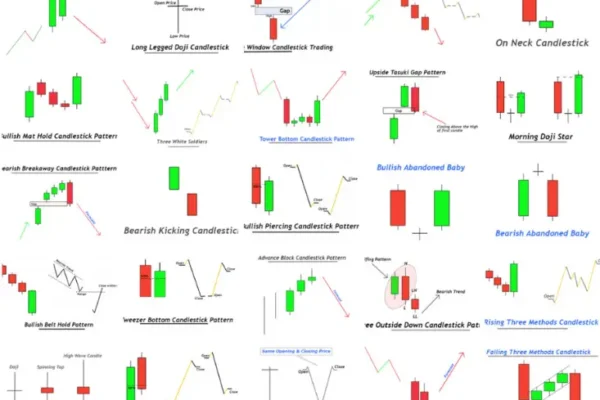
What is candlestick & why we use them
Candlestick Charts: Illuminating Price Patterns and Market Sentiment Candlestick charts have become an indispensable tool for technical analysis in financial markets. These visual representations of price data offer valuable insights into market dynamics, price patterns, and investor sentiment. In this blog, we will explore the concept of candlesticks, their historical origins, and the reasons behind…


