What is candlestick & why we use them

Candlestick Charts: Illuminating Price Patterns and Market Sentiment
Candlestick charts have become an indispensable tool for technical analysis in financial markets. These visual representations of price data offer valuable insights into market dynamics, price patterns, and investor sentiment. In this blog, we will explore the concept of candlesticks, their historical origins, and the reasons behind their widespread usage in price charts.
Understanding Candlesticks:
Candlesticks are graphical representations of price movements within a specified time period. Each candlestick consists of a body and two wicks (also known as shadows or tails). The body represents the range between the opening and closing prices, while the wicks represent the high and low prices within the time period.
Historical Significance:
The origins of candlestick charts can be traced back to 17th-century Japan, where they were initially used to analyze rice markets. Munehisa Homma, a Japanese rice trader, developed the technique to gain insights into market psychology and predict future price movements. Over time, candlestick charts gained popularity and were adopted by traders across different markets globally.
Visualizing Price Patterns:
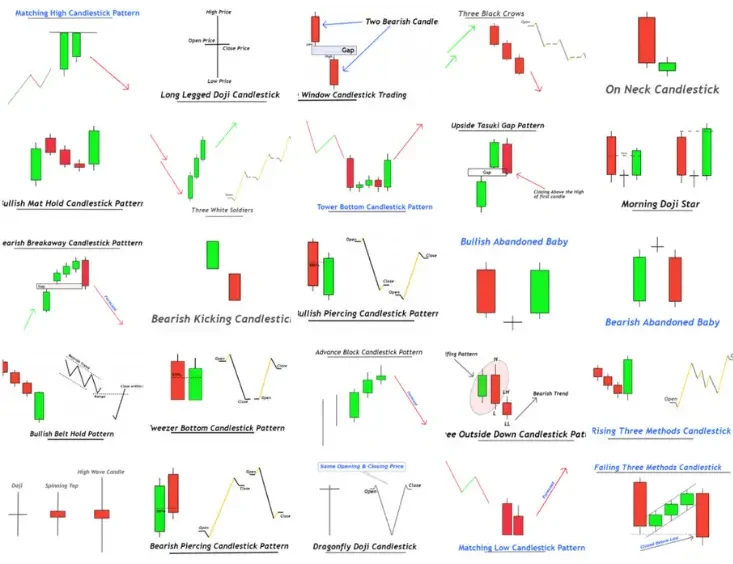
Candlestick charts offer a visual representation of price patterns, aiding traders in identifying trends, reversals, and market sentiment. Various patterns, such as doji, hammer, engulfing, and shooting star, provide valuable signals about market dynamics. Traders analyze these patterns alongside other technical indicators to make informed trading decisions.
Interpreting Market Sentiment:
Candlestick charts provide valuable insights into market sentiment and the tug-of-war between buyers and sellers. Bullish candlesticks, where the closing price is higher than the opening price, indicate buying pressure and optimism in the market. Conversely, bearish candlesticks, with the closing price lower than the opening price, suggest selling pressure and pessimism. The length of the wicks relative to the body also provides clues about market volatility and potential reversals.
Advantages of Candlestick Charts:
- Visualization:
Candlestick charts offer a visually appealing and intuitive representation of price data, making it easier to interpret market movements. - Pattern Recognition:
Candlestick patterns allow traders to identify potential entry and exit points based on historical price behavior. - Timing:
The time frame of candlesticks can be adjusted to match different trading strategies, from short-term scalping to long-term investing. - Confirmation:
Candlestick analysis can confirm or supplement other technical indicators, enhancing the reliability of trading signals.
Candlestick charts provide a powerful visual tool for traders and investors to analyze price patterns, identify market sentiment, and make informed trading decisions. These charts have a rich historical background and offer valuable insights into market dynamics. By mastering the interpretation of candlestick patterns and incorporating them into comprehensive trading strategies, individuals can enhance their ability to navigate the complexities of financial markets. Embrace the candlestick’s illuminating power and unlock the secrets hidden within price charts.


Go Eco with our Travel Guide
Sustainable tourism Eco-communities and their tourist infrastructure.
Also Checkout our new free blog posting website.
InMotion Hosting: InMotion Hosting offers fast and reliable hosting services with excellent customer support. They provide a variety of hosting options, including business hosting, VPS hosting, and dedicated servers.
Bluehost: It is one of the most popular hosting providers, recommended by WordPress. They offer a user-friendly interface, excellent uptime, and 24/7 customer support. http://webward.pw/.
company registration in united kingdom payment processing license belgium.